Collaborative visualization of personal data for behaviour change
technique · Article · vendredi, 18 septembre 2015 à 22:26:51 · 12 min
It's been almost four months now that I've been working on this: as part of my doctorate, I've temporarily set aside programming and web analytics to devote myself to another subject, namely "collaborative visualization of personal data for behaviour change". In English, that gives "collaborative visualization of personal data for behaviour change", which sounds better, and my thesis may well take that name.
We're talking here about different research fields, combined to allow the average person to improve their daily life habits. Concretely, it's about thinking through the most effective "human-computer interfaces" (HCI) to convince users, willy-nilly, to save energy, stick to their diet, or improve their productivity at work. These past few months have been an opportunity to read close to a hundred papers on the subject (or rather, the subjects) in order to establish a "state of the art". I feel like pouring out about all this, more freely than in a scientific article: that's the reason for this new post.
Information visualization and its sub-fields
Some research fields sound better in their original language: by "information visualization" (infoVis), we mean the study of the most effective visualization methods for understanding and exploring vast and complex data. This branch, still quite fashionable in scientific circles, is currently giving birth to various sub-categories, such as "casual information visualization", "personal visualization" or "collaborative visualization". I didn't pick these examples at random: they are all useful in the context of my work.
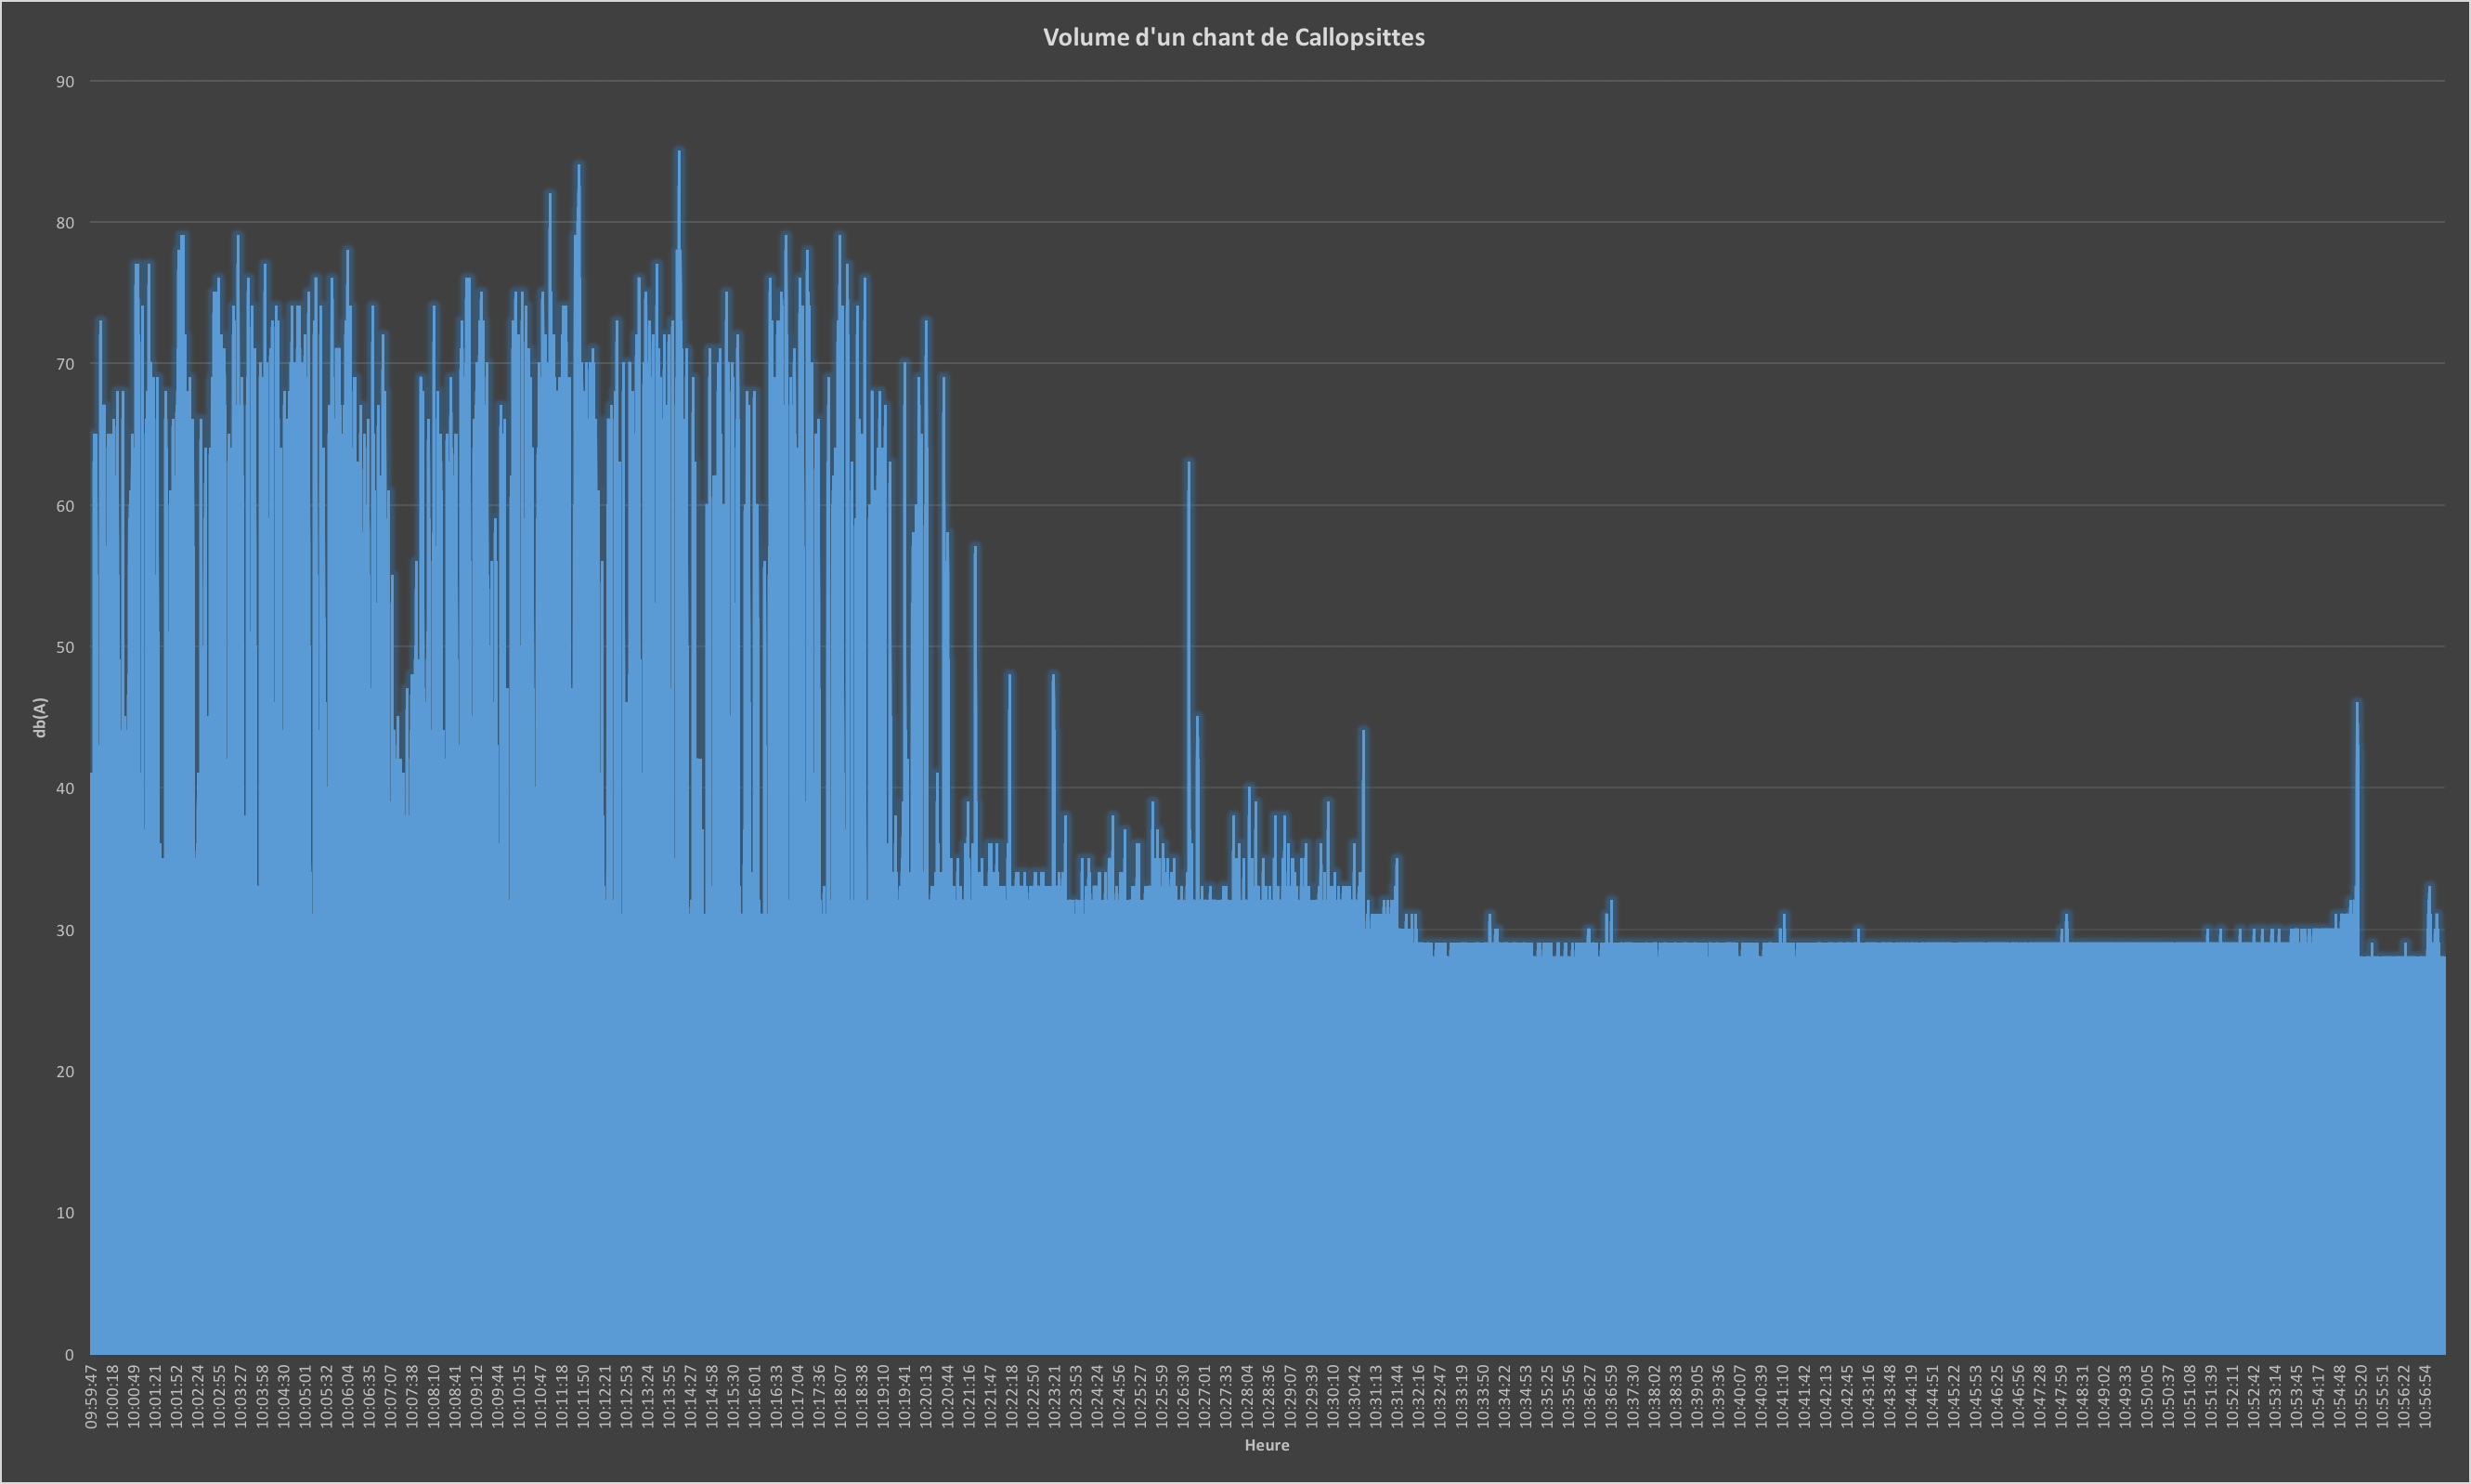
Using visualizations to facilitate reasoning has proven its worth in many studies. If in doubt, you can convince yourself with the following exercise: below is the decibel reading of the noise generated by our cockatiels a few days after their arrival at home (the reading comes from an iOS app that isn't necessarily very reliable). First referring to the PDF list of values, then to the visualization presented below, try:
- To categorize the distribution ("do the cockatiels make more or less noise as the readings go on?")
- To find the maximums ("how many decibels do the cockatiels sing up to?")
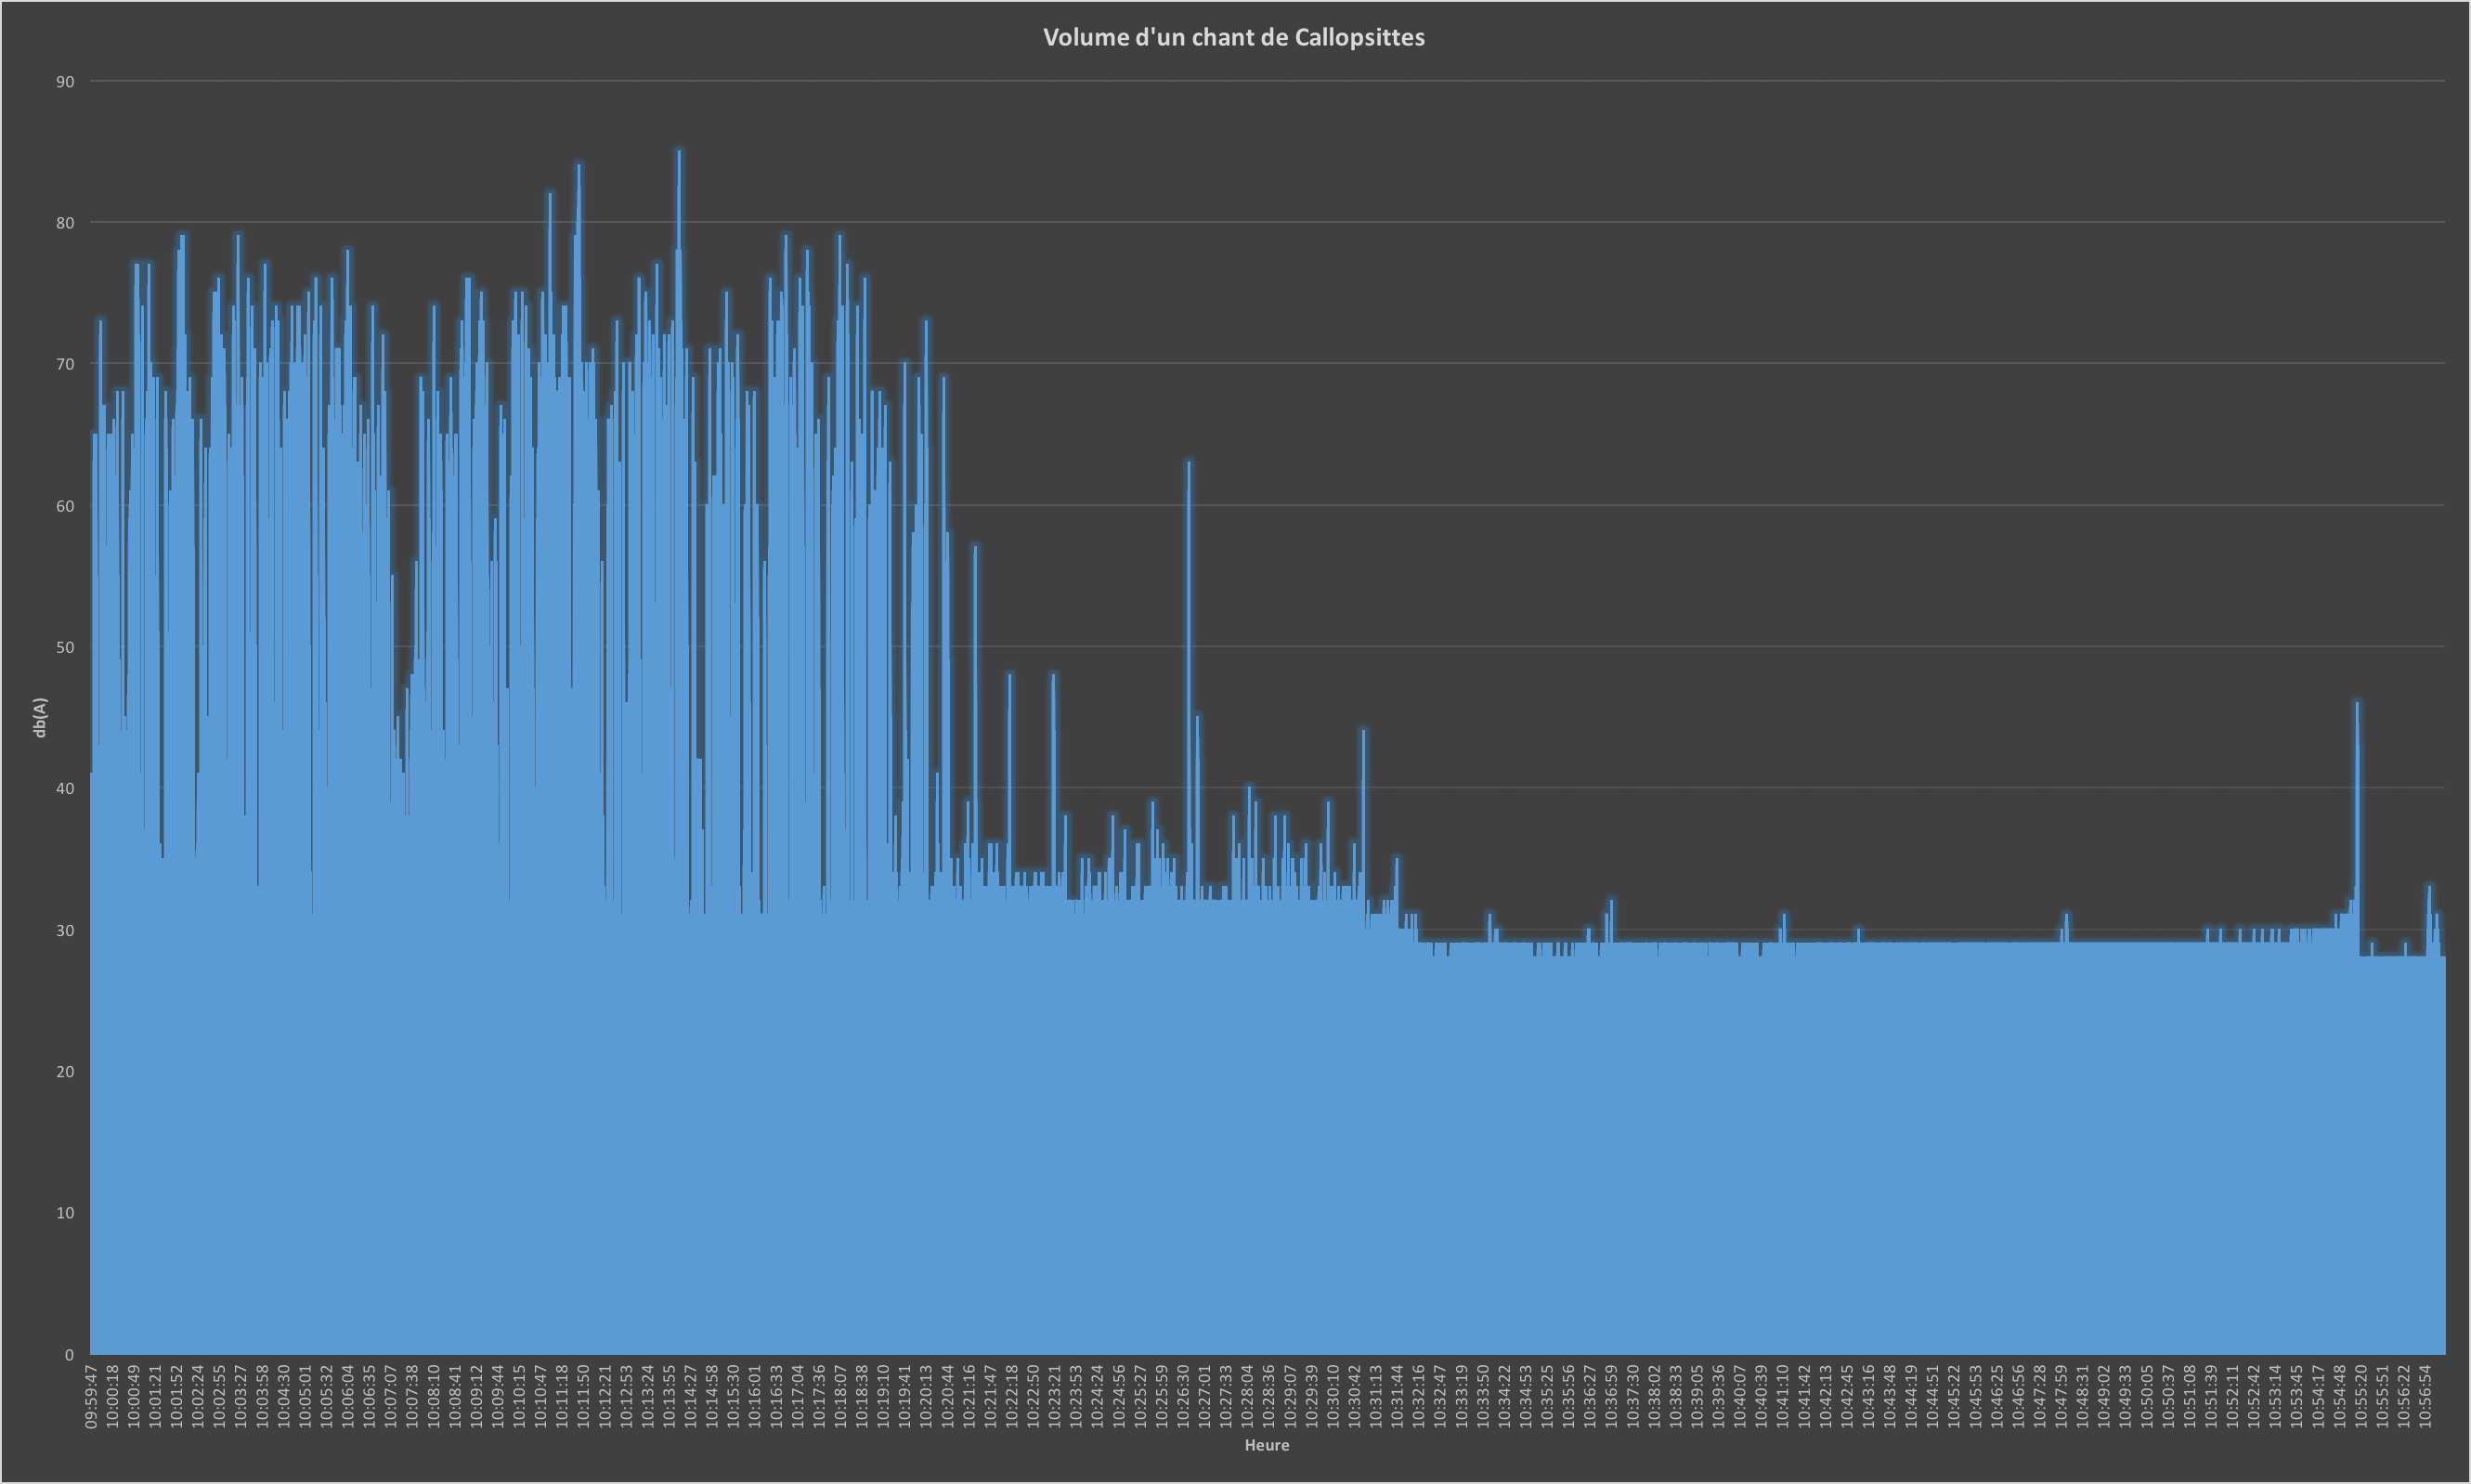
You will quickly notice that the answers can be obtained in the blink of an eye with the help of a visualization, even a simplistic one. This field studies all the advantages visualizations represent and the most effective methods to get the maximum benefit from them.
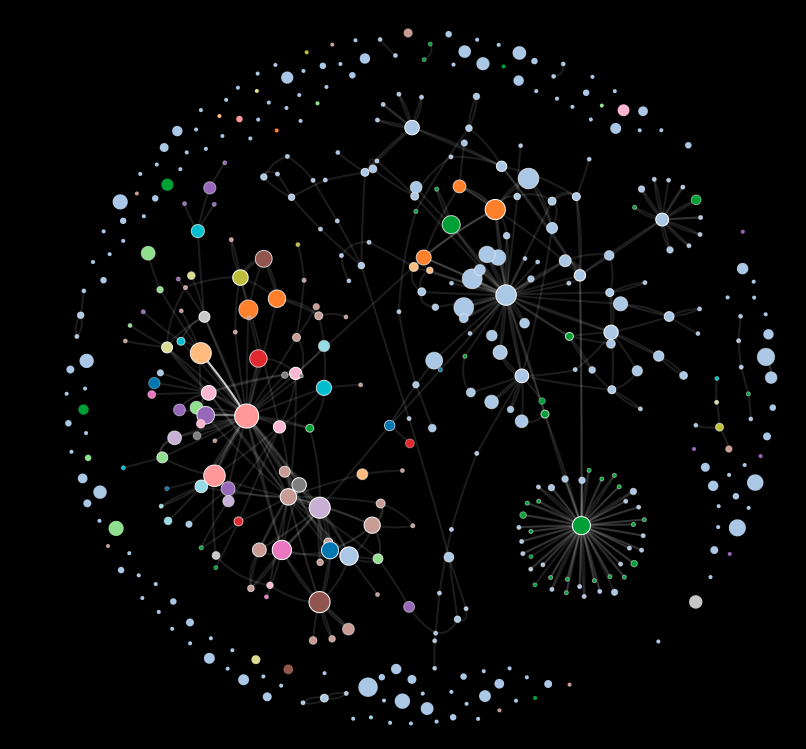
The visualizations produced by "Constel Analytics" can be artistic.
Information visualization has always targeted seasoned users, like scientists or professionals who need to think about a data set with a specific goal in mind. Yet technological development daily confronts us with data to interpret even beyond the professional sphere, regardless of our skills. "Casual information visualization" (a poor translation of "Casual InfoVis") highlights this fact and proposes thinking about visualizations that make sense for non-expert users. The goals, but above all the methods for attracting these users, are different. Think for example of "artistic" visualizations: their goal is to convey a message aesthetically while basing themselves on factual data. Infographics, much used in recent years, also belong to this category.
"Personal visualization" gathers all the methods seeking to display data from our daily lives, among other things to help us improve our behavior. Here we enter directly into my research topic. This field is starting to break through, so the scientific community is only at the definition stage: it will take a few more months, even years, before we can speak of an established field. Let's hope this October workshop helps us see more clearly.
As for "collaborative visualization", it is a field that isn't formally defined, but some scientists do take an interest in it. The idea is to study by what means a visualization can allow several people to work simultaneously. For readers who know certain Call of Cthulhu campaigns, the value of being able to work with several people on a visualization probably jumps right out…
Computer-supported cooperative work
With the InfoVis question dealt with, let's grab the rope by the other end: the "Computer Supported Cooperative Work" (CSCW). Here, we study all the computer-based means that allow people to work together. I combed through five years' worth of conference proceedings, which contained papers on gamers' attachment to their MMORPG avatars, on the risks of bias within a team, or on wedding planning assisted by modern technologies.
One of my existential questions was whether collaborative work with visualizations brings real added value compared to individual work. Naively, one might believe it does: however, it has been demonstrated many times over that collaborating requires synchronization efforts that can slow down reasoning, without limiting biases and errors for all that. Not content to stop at this observation, researchers have put forward the idea that collaborative use of a visualization only offers added value from the moment each team member has only part of the information, so that they must discuss to obtain a more global view. This promising discovery will no doubt have to be corroborated by other papers, but it constitutes a good starting point for anyone wishing to design a collaborative visualization system.
Persuasive technologies
An important point from my readings is that the rare collaborative visualization systems often get fairly good results in the lab, while they fail miserably in field deployments over several months. Worse still: the famous "smart meters", those boxes supposed to give end users more control, deliver only paltry results (energy savings of about 2%). The height of irony, considering that many Western governments are seeking to deploy them massively to the tune of several billion euros. Everything suggests the main reason for these failures stems from the lack of interest people show in these technologies. No hesitation on this point: anyone who wants to design a collaborative visualization system for end users **must **take this "laziness" into account, on pain of learning things the hard way, like so many companies before.
|| Around 2010, a good number of companies (start-ups, multinationals, ...) jumped into the smart-metering adventure.
Five years later, the picture is damning: Google and Microsoft have pulled out of the "market", and the small startups have either closed or been bought up by electricity providers.
Beyond the "the market isn't ready yet" narrative, the reasons for these failures are still debated. I think the same thing will happen to the "quantified-self" market (fitness and health with smartwatches, ...).
There are several research fields interested in motivation management, mainly on the behavioral psychology side. Closer to computer science, "persuasive technologies" form a particularly extensive field, to which many sub-branches can be attached - ones that aren't necessarily aware they belong to it. This research field gathers all the studies on the use of technologies to modify users' behavior without resorting to coercive methods (basically, without rapping you on the knuckles... at least, not too hard). If you search for "persuasive technology" on Google Trends, you'll be surprised to find the field is rather rarely searched: it fades in favor of other sub-branches with more *catchy, *like "Behavior Change" (more general) or "Gamification" (much in fashion).
My research revealed that end users are more inclined to use smart meters that work as "self-monitoring" tools: you shouldn't just put a screen somewhere and hope it gets used, but rather catch users' attention when their energy consumption is abnormal. They will no doubt wonder why, and will then be able to analyze their behavior. Conversely, "gamification", which consists of using video game mechanics in a non-playful context to stimulate engagement, seems dangerous to me both morally and in effectiveness: so take a look at Richard A. Bartle's presentation on the subject to convince yourself.
What to do with all this?
My state of the art has allowed me to establish a few broad guidelines for anyone wishing to design a personal data visualization system. The first important aspect is that we - the end users - are little inclined to spend time on visualization tools. This is the basis of the *design *of my future system. It will consist of three layers:
- ambient lighting that changes according to energy consumption
- an application for visualizing and exploring energy consumption data
- a web platform for exchanging and collaborating on the subject
The goal of the ambient lighting is to offer users a
*feedback *
that stays constant, informing them of any abnormal spikes in their energy use. The idea is also to regularly draw them to the visualization application, which will let them analyze their consumption in more detail. Where possible, this application will suggest solutions / winning strategies used by other users (this system must nevertheless guarantee everyone's untraceability and anonymity). The web platform will work as a hotline " crowdsourced" to allow people to get advice from other users. This is where the "gamification" mechanisms can come in: in the manner of stackoverflow, the most effective contributions will be highlighted by the community in order to create a virtuous cycle.
My goal is to set up this system - even a wobbly one, in the form of a working prototype - by the end of the year. On this basis, I will be able to test all the hypotheses raised above during deployments of several months.
A few references
- Balakrishnan, A., Kiesler, S., Kittur, A., & Fussel, S. (2010). Pitfalls of Information Access with Visualizations in Remote Collaborative Analysis. Proceedings of the 2010 ACM conference on Computer supported cooperative work (pp. 411-420). ACM.
- Bartle, R. A. (2011). Gamification: Too much of a good thing. Retrieved July 14, 2015, from Presentation given at 'Digital Shoreditch': http://www.scribd.com/doc/81716927/Gamification-Too-Much-Of-a-Good-Thing
- Bouton, M. (2014). Why behavior change is difficult to sustain. Preventive medicine , 29-36.
- Bresciani, S., & Eppler, M. (2009). The Benefits of Synchronous Collaborative Information Visualization: Evidence from an Experimental Evaluation. Visualization and Computer Graphics, IEEE Transactions on , 15 (6), 1073-1080.
- Buchanan, K., Russo, R., & Anderson, B. (2015). The question of energy reduction: The problem(s) with feedback. Energy Policy , 89-96.
- Costanza, E., Ramchurn, S. D., & Jennings, N. R. (2012). Understanding Domestic Energy Consumption through Interactive Visualisation: a Field Study. UbiComp ’12 .
- Darby, S., Liddell, C., Hills, D., & Drabble, D. (2015). Smart Metering Early Learning Project: Synthesis report.
- Delmas, M., Fischlein, M., & Asensio, O. (2013). Information strategies and energy conservation behavior:. Energy Policy , 61, 729-739.
- Goldstein, N., Cialdini, R., & Griskevicius, V. (2008). A Room with a Viewpoint: Using Social Norms to Motivate Environmental Conservation in Hotels. Journal of Consumer Research , 35 (3), 472-482.
- Hamari, J., Koivisto, J., & Sarsa, H. (2014). Does Gamification Work? — A Literature Review of Empricial Studies on Gamification. Proceedings of the 47th Hawaii International Conference . Hawaii.
- Heer, J., & Agrawala, M. (2008). Design considerations for collaborative visual analytics. Information Visualization , 7, 49-62.
- Heer, J., Viégas, F., & Wattenberg, M. (2009). Voyagers and Voyeurs: Supporting Asynchronous Collaborative Visualization. Communications of the ACM , 52 (1), 87-97.
- Huang, D., Tory, M., Aseniero, B., Bartram, L., Bateman, S., Carpendale, S., et al. (2014, September 22). Personal Visualization and Personal Visual Analytics. IEEE Transactions on Visualization and Computer Graphics , 420-433.
- Isenberg, P. (2009). Collaborative Information Visualization in Co-located Environments. Calgary.
- Isenberg, P., Elmqvist, N., Scholtz, J., Cernea, D., Ma, K.-L., & Hagen, H. (2011). Collaborative Visualization: Definition, Challenges and Research Agenda. Information Visualization , 10 (4), 310-326.
- Klasnja, P., Consolvo, S., & Pratt, W. (2011). How to Evaluate Technologies for Health Behavior Change in HCI Research. Proceedings of the SIGCHI Conference on Human Factors in Computing Systems (pp. 3063-3072). ACM.
- Owens, S., & Driffill, L. (2008). How to change attitudes and behaviours in the context of energy. Energy Policy , 4412-4418.
- Pousman, Z., Stasko, J., & Mateas, M. (2007). Casual Information Visualization: Depictions of Data in Everyday Life. Visualization and Computer Graphics, IEEE Transactions on , 13 (6), 1145-1152.
- Rathi, S., & Chunekar, A. (2014). Not to buy or can be ‘nudged’ to buy? Exploring behavioral interventions for energy policy in India. *Energy Research & Social Science *, 78-83.
- Rego Teixeira, A. (2014). Le « Smart-metering » en Suisse Romande : conditions sociales d’acceptation et d’appropriation. Genève.
- Shepperd, J. (1993). Productivity Loss in Performance Groups: A Motivation Analysis. Psychological Bulletin , 113 (1), 67-81.
- Spence, A., Bedwell, B., Leygue, C., & O'Malley, C. (2014). Engaging with energy reduction: Does a climate change frame have the potential for achieving broader sustainable behaviour? Journal of Environmental Psychology , 17-28.
- Sprague, D., & Tory, M. (2009). Motivation and Procrastination: Methods for Evaluating Pragmatic Casual Information Visualizations. IEEE Computer Graphics and Applications - CGA , 29 (4), 86-91.
- Thaler, R., & Sunstein, C. (2009). Nudge: Improving Decisions About Health, Wealth and Happiness. Penguin.
- van Elburg, H. (2014). Dutch Energy Savings Monitor for the Smart Meter.
- Westskog, H., Winther, T., & Sæle, H. (2015). The Effects of In-Home Displays—Revisiting the Context. Sustainability , 7, 5431-5451.
- Willett, W., Heer, J., Hellerstein, J., & Agrawala, M. (2011). CommentSpace: Structured Support for Collaborative Visual Analysis. Proceedings of the SIGCHI conference on Human Factors in Computing Systems (pp. 3131-3140). ACM.