Blog statistics
technique · Article · mardi, 22 septembre 2015 à 11:47:46 · 8 min
A bit of a catch-all article following my publications on the blog's evolution. An opportunity to look back at the results of the theme change, to discuss the problems tied to the evaluation of these results, and to draw conclusions. As usual, my blog serves as a use case to illustrate the application of certain web analytics concepts, which may perhaps help you improve the measurement of your own site.
This article was written a long time ago, when the blog still ran on WordPress. Its information is not necessarily up to date.
The blog, in general
At the end of 2013, WordPress told me the Archives d'Anubis had been viewed 4,300 times... over a whole year. A rather low score, it must be admitted, even for a small personal space without great pretension. In 2014, the 4,300-visit threshold was crossed in early October. Today, we stand at 5,300. One can estimate that the Archives will have attracted 6,000 visitors by the end of the year, an increase of about 50%. A nice improvement that owes much to a more thorough management of my online search ranking (a post on this topic to be expected very soon!).
It is a nice score. But here is the thing: the number of visits, we don't care about it. What counts above all is the reading rate: on a daily basis, 4-5 visitors who enjoyed the blog's content are better than a horde of barely interested channel-surfers.
The theme and the stats
In August 2014, I decided to create my own WordPress theme. The goal was to increase the blog's reading rate by highlighting its content: particular care was given to typography and to the space dedicated to each article's content, at the expense of pure, hard aesthetics. The theme went online almost three months ago, so it is finally possible to check whether the goal was reached.
Below, the numerical results, taking into account the three metrics and the three segments previously used. One small difference this time: the monthly view replaces the daily view, the latter being no longer relevant to grasp the blog's evolution.
As a reminder, the blue bar (bounce rate) is ideally supposed to drop while the other two (number of actions and time spent on the site) are supposed to rise. Whatever the segment, one notices that since the theme went online (August 29, 2014), the statistics are moving in the right direction. Obviously, when taking my activity into account ("All visits" segment), the statistics for September are better than those of the following months: I was indeed less active in recent weeks, which skews the results. Still on the subject of skewed results, the addition of an event to indicate when visitors finish reading an article did not impact the bounce rate as much as I believed: in truth, the "French" and "New visitors" segments even experienced a slight rise in bounce rate after September 15. This rise would plausibly have been worse had the event not been implemented. The fact remains that this event also created some surprising bounces: I discovered that a certain number of visitors open a page, leave it hanging for hours, and finish reading it when night falls (which therefore generates two bounces instead of a single one, since the visit's duration is such that Piwik interprets it as two visits of a single action).
More worryingly, the weekly statistics show that these past few weeks have seen a decrease in time and actions in favor of an increase in bounces. Loss of interest? A winter phase making web surfers less inclined to read? Hard to say, but I hope it will not continue.
That said, apart from this small caveat, we still notice a decrease in bounces from 85% to 45%, a doubled average visit time, and a slightly rising number of actions!
The theme is bound to evolve by the end of the year. The goal will be to strengthen the aesthetics, to rework the menu and the home page - an opportunity to talk about A/B testing and how Piwik can help you with that. Stay tuned!
Even sharper statistics
The metrics used since September suffer from certain limitations (detailed in the article) that I am currently trying to work around. After discussing bounces and events, it is time to tackle two other measures well known to web analysts: goals and custom variables.
Goals
Ultimately, knowing whether a visit lasted 3 minutes or 3 hours does not matter for this blog. From the moment the time spent on an article seems enough for it to have been read, one can consider the goal reached. The ideal would even be for a visitor to spend 3-4 minutes on several articles, which would prove their content interested them. Instead of taking into account the average time spent on the blog, one should therefore define a time threshold from which an article can be considered read. Web analytics systems allow you to set up goals: the idea is that you will define what your site is supposed to be for, and decide how this purpose will be evaluated.
The form to fill in to create a goal in Piwik.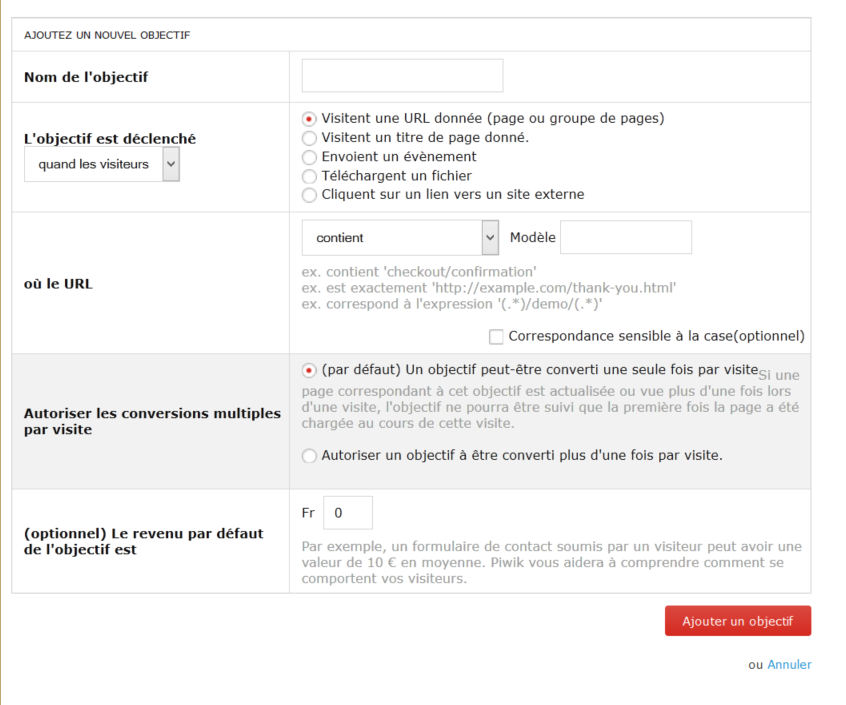
Concretely, the average length of my articles is about 1,000 words, read at an average speed of about 300-400 words per minute. One can therefore consider that it generally takes at least 2 minutes to read one of my articles. The idea is thus to create a goal that will depend on the time spent on the article when the visitor reaches its end.
The first thing to do is to create a goal in Piwik's interface. To do so, nothing could be simpler:
- Go to Piwik's "Goals" menu.
- Choose a name for the goal (in my case, "Read articles").
- Click on the drop-down menu below "The goal is triggered" and choose "manually".
- Choose whether a single visit can trigger the goal several times (in my case, yes).
- If you were able to estimate the revenue generated by the goal, enter its value.
That is all for Piwik's interface.
You then need to add a small bit of Javascript to your articles' footer, so as to detect whether the time spent by your visitors is sufficient to trigger the event. The core of this snippet was detailed in the post about events; it just needs one small addition:
var hasConverted = 0;
if(timeSinceArrival > 120 && !hasConverted)
{
	_paq.push(['trackGoal',  1]);
	hasConverted = 1;
}
And there you go, you can now see which visits fulfill your goal. When a goal is fulfilled, we speak of a conversion: a goal's conversion rate represents the percentage of visits that fulfill said goal.
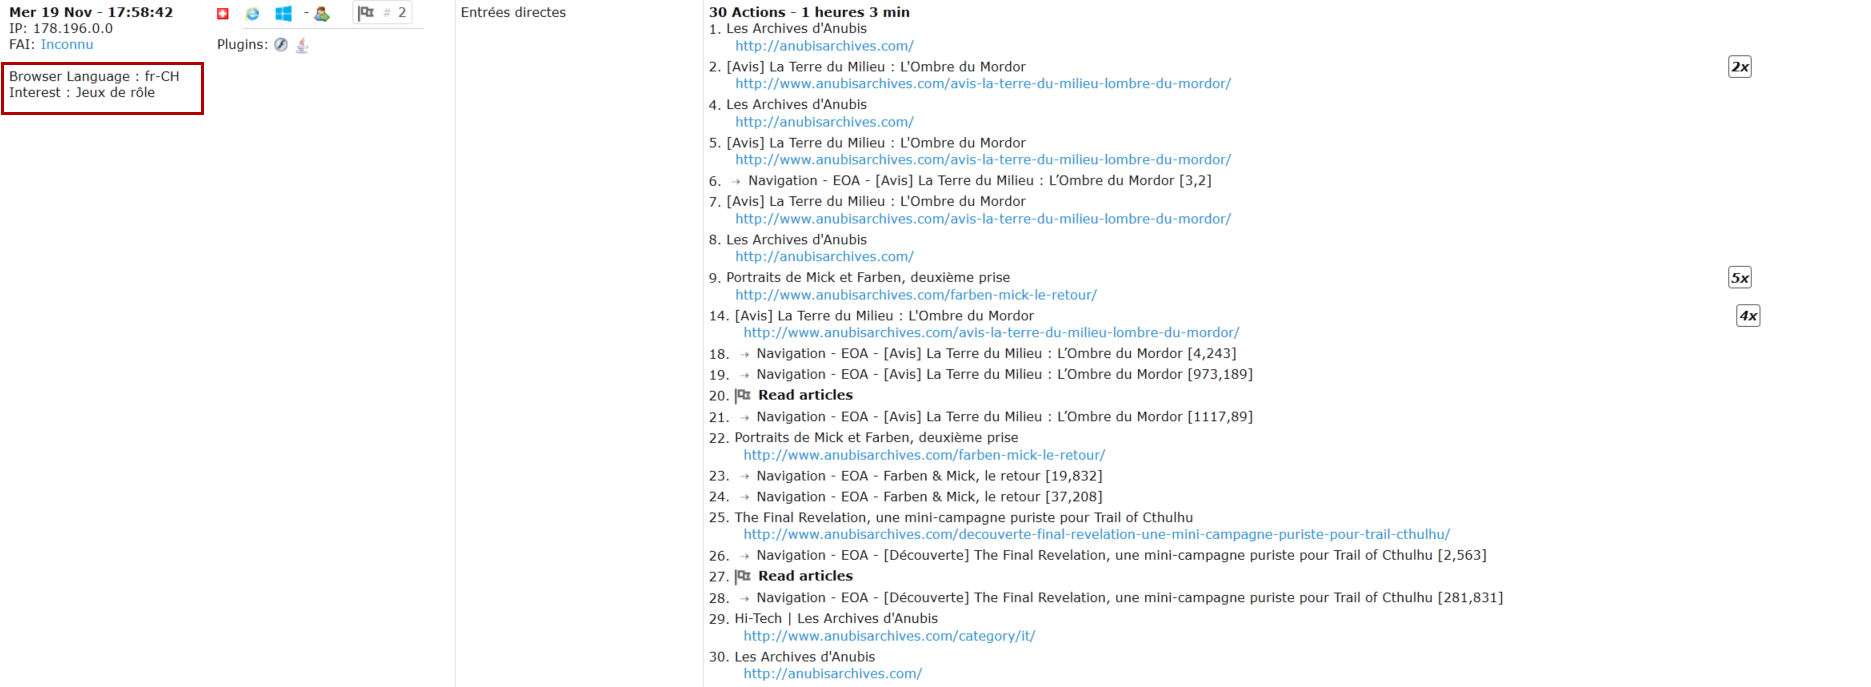
This is what a goal looks like in Piwik's Live View: a small flag in the header signals the total number of conversions for the visit, and several flags follow one another between the actions to show when these conversions took place.
The next statistical check-ins on this blog will therefore skip the number of actions and the average time spent on the site, to focus instead on the conversion rate and the number of conversions. More readable, more efficient!
Custom variables
Last notable change in my use of Piwik, the addition of custom variables will allow me to establish visitor categories and test the behavioral differences between them (thereby accomplishing one of the goals left pending on Constel Analytics). A custom variable is a piece of information you are free to assign to a visit or a page, depending on your needs. For example, Piwik does not record your visitors' browser language (not in the "fr-FR" form): if you want to do so, you will have to create a variable that could be called "Browser Language" and manually send this information in Javascript. On Piwik, you can assign up to 5 custom variables to a visit or a page. In addition to "Browser Language", I created a second variable named "Interest", which is meant to represent the center of interest of this blog's visitors. On this basis, I will be able to establish segments according to my visitors' interests and see to what extent these different populations read the articles presented there. For the time being, the "Interest" variable's computation is rudimentary: I merely send the category of the last article read during the visit. Eventually, one can imagine complex algorithms to estimate a visitor's main interest, based on the time spent on certain types of articles.
The snippet to implement these two variables is child's play:
var userLang = navigator.language || navigator.userLanguage; // We retrieve the browser's language
_paq.push(['setCustomVariable', 1, 'Browser Language', userLang, 'visit']); // We send it
var postCategory = code PHP; // We retrieve the name of the post's category(ies) in PHP
_paq.push(['setCustomVariable', 2, 'Interest', postCategory, 'visit']); // We send it
And voilà, as our friends across the Channel would say. You can see these custom variables next to each visitor's technical information, in Piwik's visit details. With this, I will finally be able to answer a fundamental question: are gamers worse readers than RPG players? Answer to follow within a few months...
The result in the visit details [highlighted in this beautiful crimson box on the left].